The Yields They Are A Risin’

The Echelon Insights Team • Mar 02, 2021

Market Recap – A carbonated concoction of volatility


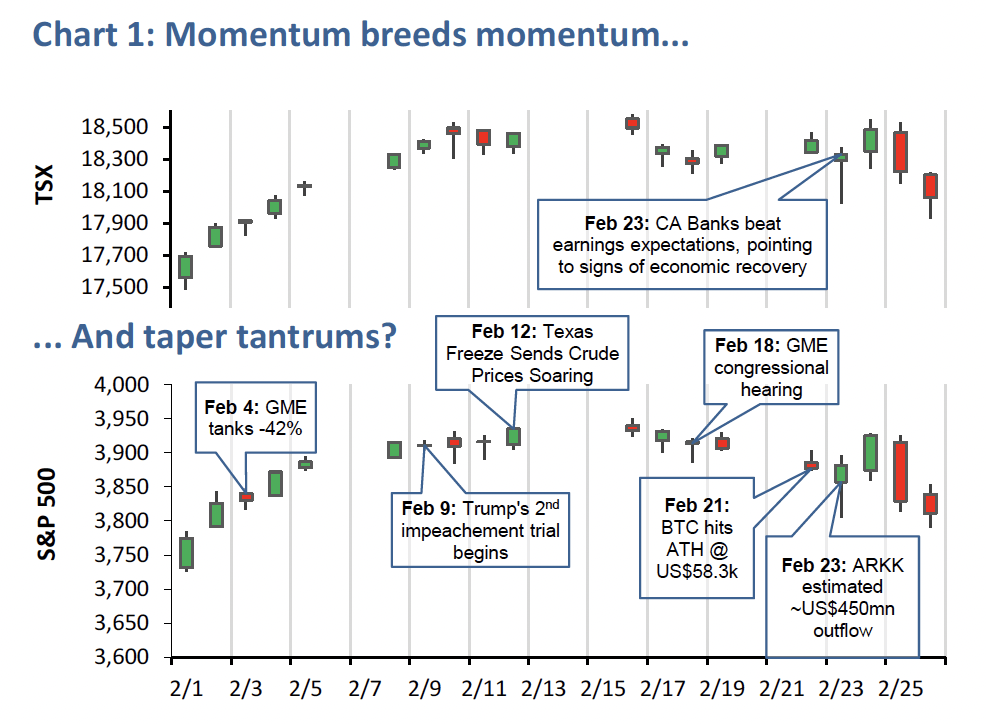
  • On the back of January’s volatility, February saw market participants step harder on the throttle and enable a protracted runofrisk-on activity to an extent not observed in decades (Chart 1). 


  • February’s frothy backdrop was comprised mainly of (1) a successful continuation of COVID-19 vaccination administrations across the globe; (2) patient and (seemingly) stubborn signaling from the Federal Reserve and other central banks in combination with newly awoken hopes for additional fiscal stimulus; (3)ever-growing interest in investing from the retail community, as exhibited by Reddit’s r/wallstreetbets user growth to ~9.3mn
    (+40% m/m); (4) sustained idiosyncratic pockets of speculative mispricings across a variety of assets / securities, most notably in thematic highflying equities and cryptocurrencies; and (5) a steady rise in global yields, followed by a last-minute inflection to pre-election highs during the month’s
    last week.


  • North American equity markets made advances higher for most of the month but retracted gains near its end as Treasury yields inflected higher at the last minute. In local currency terms, the S&P 500 posted a total return of +2.8% for the month while the TSX Composite returned +4.4% during the same period. Overseas markets, measured by EAFE in CAD terms, returned 1.5%.


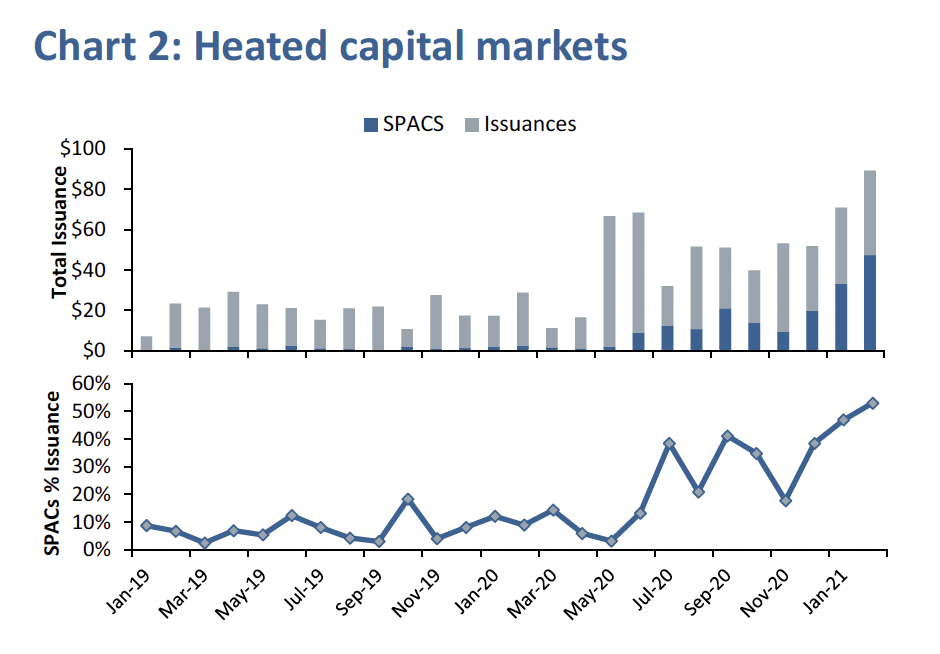
  • North American capital markets set a +10-year record high for monthly equity issuance activity, driven in large part by the U.S.SPAC craze (Chart 2). During this month alone, 680 equity issuances were announced that in aggregate ascribed a total of ~US$94bn in new capital; of this figure, ~55% came from SPACs. 


  • The big question here is whether these recent spikes in activity are drivers for today’s heated markets, or if the inverse is true. The answer likely errs towards this relationship being reflexive. At this point, it is becoming increasingly more difficult to distinguish between the horse and the carriage.


  • Reflationary trades paid off, as the month was also marked by a decided increase in global bond yields, which was most notable during the last week of the month when U.S. 10-years peaked momentarily at ~1.6%. As we discuss later in this report, global economic recovery expectations have given way to steeper yield curves and pronounced outperformance in the commodities complex.


  • Maneuvering through these volatile waters may appear more daunting than ever; rest assured that mental fortitude, a tempered hand, and deliberate intent will serve well in this environment. 


  • While the extremes in behaviour we are witnessing today may seem novel, history will tell us that this may be no different from the past. Human nature rarely changes; only the means and mediums through which this behaviour is cultivated and fostered are now different.

Asset Allocation – Yields toll for thee


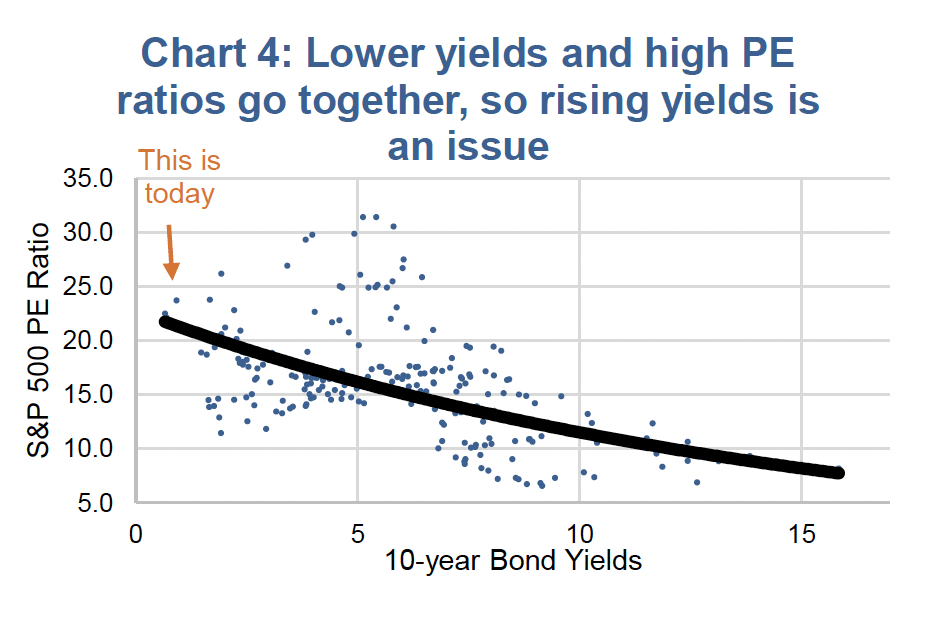
  • Bond yields and equity markets have a rather finicky relationship. Sometimes, falling yields are good and sometimes bad. Samewith rising yields. We have opined for a few months now that the rise in bond yields, a development that started in August, is a healthy turn of events but at some point would weigh on equity markets and valuations. The markets and many asset prices have been inflated thanks to monetary policy and low bond yields. Lower bond yields are correlated with higher market valuations, so naturally rising bond yields are a headwind. But it is not that simple (it never is).


  • Bond yields are rising for a very good reason: the global economic recovery continues to gain momentum on the back of vaccine rollouts putting the end of this pandemic in sight. The opening-up trade is gaining and few would argue this is a very welcome development. However, there is a pain point should yields rise too far or too fast. The equity markets experienced a taste of this in late February. The 10-year U.S. Treasury yield, which had been steadily rising, jumped over 14 basis points (bps) in one day sending equity markets into a bit of a tizzy. 


  • We continue to believe that bond yields will move higher in the coming months and this will continue to weigh on equity prices, especially the more interest rate-sensitive sectors and the longer-duration growth companies (aka large-cap tech). This adjustment process to higher yields is well underway in some sectors (gold, consumer staples) and still in the early phases for many growth names. 


  • This could very easily push the market into a correction (10% drop or more). The industries and companies at great risk to higher yields simply carry a heavy weight in the indices of both the U.S. and Canada, although to a lesser extent. While the companies that benefit from higher yields, like financials and cyclical yield names (Read Market Ethos on Cycle Yield HERE), have a smaller representation in the indices. 


  • Looking at previous bouts of rising bond yields, it is difficult to draw hard conclusions (Chart 3). The fact is, each occurred for different reasons, in different environments and from different starting points: 1994 was over government deficits and 1999 due to an overheating economy. Perhaps the most similar to the current situation is 2009, when yields rose coming out of a recession. During the 2009 episode of rising yields, equity markets did alright, better in the early days and worse as yields got higher. We would expect a similar pattern during the current environment, if yields get too high or rise too fast, equity markets will suffer.


  • Yields could keep rising for some time. This is not just because of the low starting point, but inflationary data is startingtosurface. And, any year-over-year economic data metrics released in the coming months is going to be exaggerated because the comparable from a year ago will be in the depths of the pandemic-driven shutdowns.  


  • The good news is that this adjustment phase to potentially higher yields is a healthy event. It may create a correction due to valuations re-adjusting (Chart 4), which should be viewed as a buying opportunity. The fact is that the economic situation is getting better, the world is getting better and longer term this will be good for earnings and the markets. 

Equities – Reflation trade alive and well


  • The jump in government bond yields confirms the reflationary move in the markets that we’ve been expecting. Compared to prior bond sell-offs, this period of rising bond yields has the short end of the curve locked steady while the long end has risen due to growing expectations of an economic recovery. The trend in yields has been evident since the summer, so why is the market only beginning to care now? The recent spike in the Move Index –which is a Treasury volatility measure –distinguishes the recent move compared to the far more attritional up move in bond yields last year. We should also note that it’s not just the U.S., or the Fed, or President Biden’s $1.9 billion stimulus plan; rather, it has been a global move. From Japan to Germany, yield curves have been steepening. 


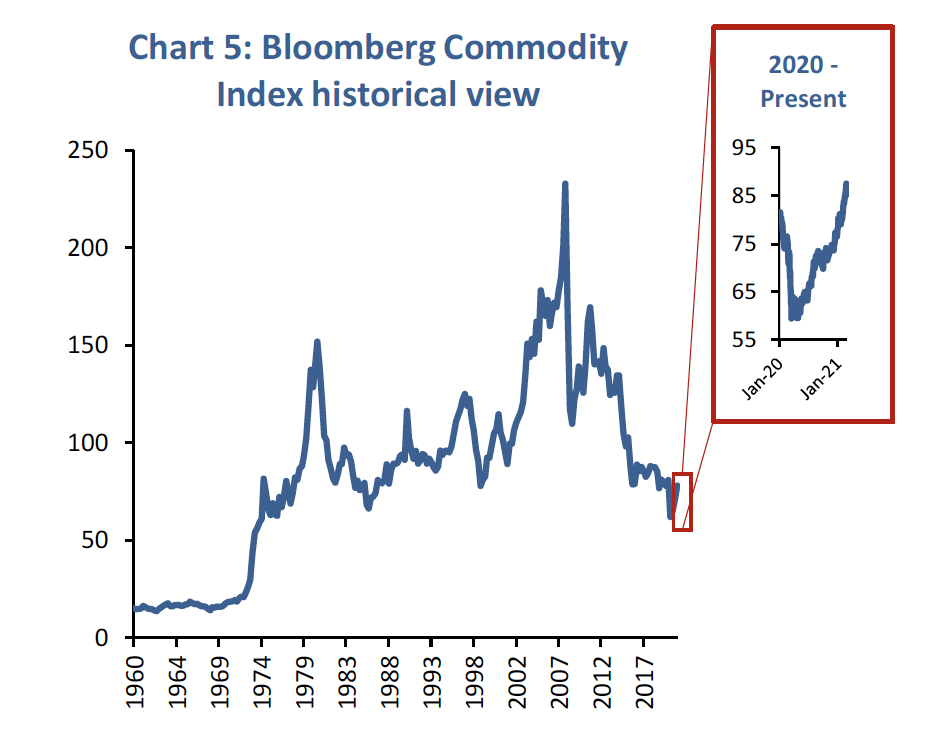
  • It’s not just the bond market that is demonstrating that the reflation trade is alive and well. Commodities too are screaming the same message. Oil prices have risen substantially, same with copper, lumber and food and the list goes on. Chart 5 shows the Bloomberg Commodity Index and if you just look at the past year, it would be easy to think that commodity prices have gotten a little out of control, however when you zoom out and observe longer term, commodities are barely at the foothills of what could be another super cycle. So far, the current outperformance of commodity markets is nothing like the 1970s or the early 2000s.One area of concern over the near term would be how stretched managed-money speculative positions are across the commodity space. Demand expectations are there, but so far, there has been a lot of speculative money driving prices higher. 


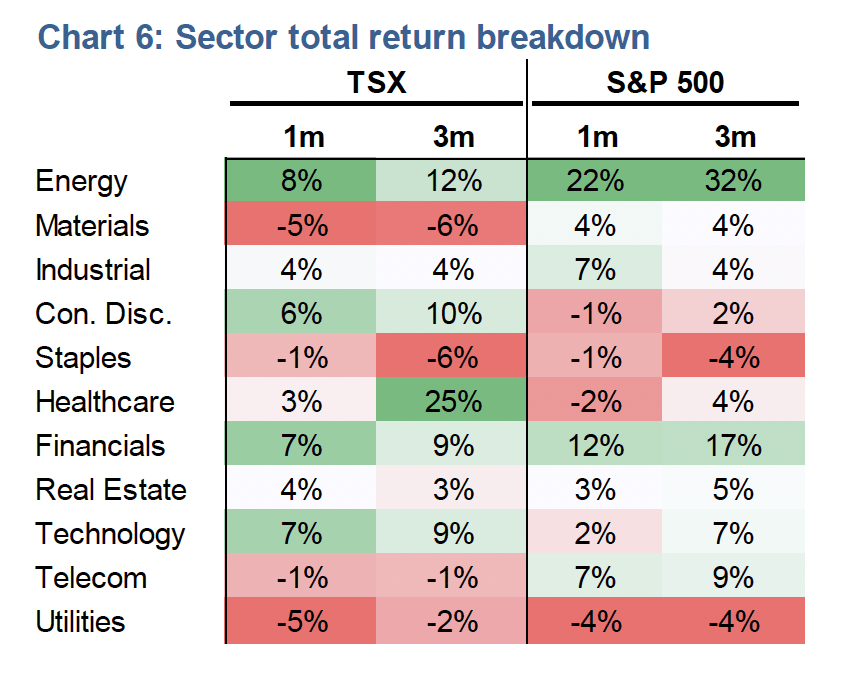
  • While a lot of attention has been paid to the likes of GameStop and other isolated asset mispricings, the reflationary trade has been driving a growing sector disparity in equity markets. The clear winners are Energy, Materials, and Financials as Chart 6 clearly illustrates in both Canada and the U.S. It’s also the reason why Canada has been outperforming U.S. markets year to date as the TSX’s combined weight of these sectors is ~55.3% versus ~16.7% for the S&P 500. Interest-rate sensitive sectors have had a tough time, with Utilities and Telecom names struggling. 


  • Markets do trend –momentum investors have built careers off this –but they also reverse, and when momentum reverses it can happen quickly. Tech tried its best to reverse course and play catch up but is having a difficult time coping with higher bond yields. As we noted in a recent Market Ethos, many of the cheaper value areas are inflecting materially higher and we expect to see a pull back in expensive growth areas. The reflation trade means that big tech and recent MOMO (or momentum) winners have lost their MOJO. The value versus growth rotation still has room to run. 


  • Markets are doing what they are supposed to do: discount events before they happen. With bankers eager to provoke inflation, and “go big” the common mantra for fiscal spending plans, we believe that the reflationary trade –while potentially overheated in the near-term –has staying power. Inflation has yet to rear its ugly head in the data, but the fear of inflation is what moves markets, not just a monthly data release. 

Equities – Emerging Markets


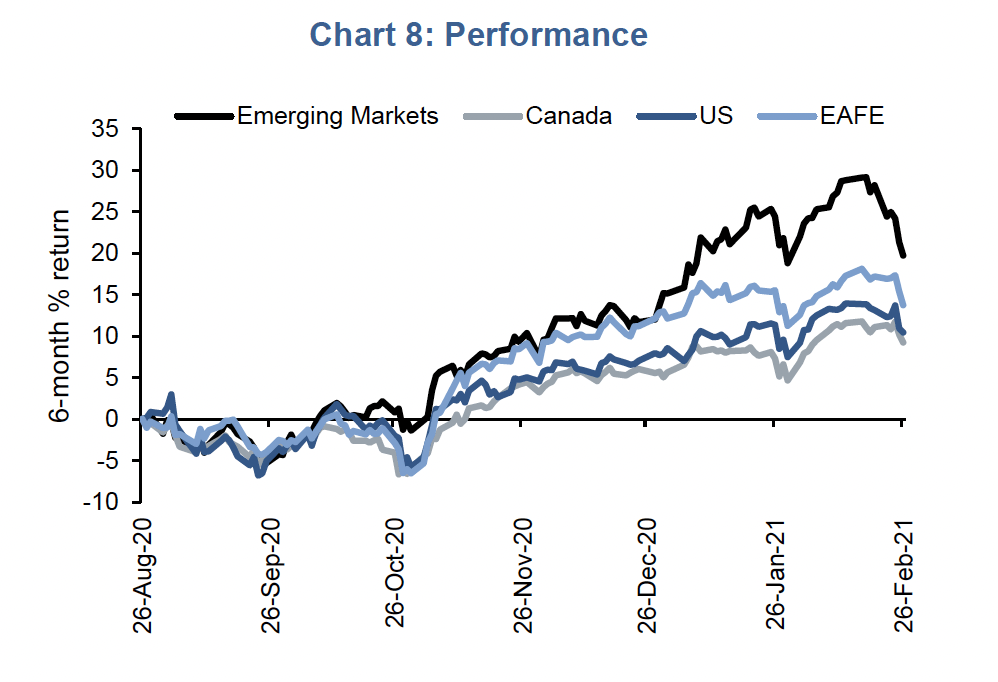
  • In September 2020, we added exposure to Emerging Markets (EM), then added again at the start of this year. We were expecting to see a rotation out of U.S. stocks into non-U.S. names while also under the notion that EM tends to outperform at the start of an expansion and reflationary environment. 


  • The trend started in the summer and has continued as economies around the world slowly recover from the pandemic. Semiconductor and commodity prices have also added to the outperformance. 


  • A restocking of semiconductor inventory has aided EM, in particular South Korea and Taiwan, but much of these growth expectations are likely already priced in. There is still a shortage, but it is waning. 


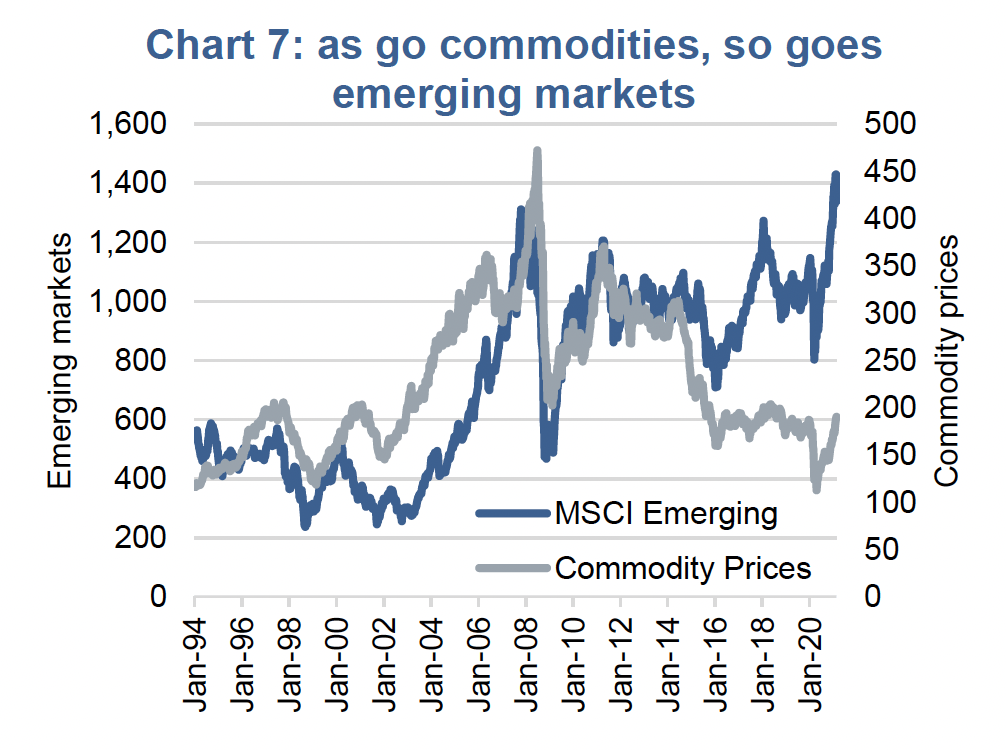
  • The Materials sector, on the back of stronger commodity prices, is the other area of optimism for EM because of the strong correlation between the two. Absolute forward earnings growth is expected to be in the mid ~20% range over the next 12 months. Industrial metal prices have also been on a tear, but historically are quite volatile and tend to be mean reverting. 


  • Much of the gain in industrial metal prices comes off the back of the early recovery in China’s economy. Demand for base metals could be sustained as the rest of the world continues to recover.


  • China dominates the EM index, accounting for 38%. Chinese returns tend to do well when house-price increases are muted and access to leverage is readily available, as is the case now. 


  • With China, Korea and Taiwan accounting for almost two thirds of the EM index, they have driven index returns as of late. The Asian market outperformance is likely going to need to continue for the trade to keep working. 


  • Like the mega-cap concentration in the S&P 500, 22% of the EM benchmark is made up of just four technology stocks. 


  • When we look at EM, we look at EM ex-China as well. Ex-China EM offers a more clinically oriented global exposure versus a domestic Chinese earnings exposure trade. Ex-China EM accounts for one-fifth of the world’s energy and resource stocks. 


  • As a result of our analysis and based on the confluence of reasons above, we are sanguine about EM and remain slightly overweight. We are not adding at this point because the easy money appears to be baked into prices. However, the space should benefit from the reflation trade and should fare better than other regions in a rising rate environment. 

Fixed Income – Optimistic outlook continues to push long-term yields higher


  • Optimism over the economic growth outlook has become the defining theme for bond markets.


  • With expectations for a sharp rebound in activity this year, yields have continued to move higher, with longer-term yields now higher than where they were prior to the pandemic.


  • Shorter-term yields however remained anchored by central bank policy rates. In February, policy makers reiterated their intention to keep short-term rates low and to continue with monetary stimulus measures until growth is fully entrenched and until inflation, which has been stubbornly low for many years, finally pushes above 2.0%.


  • Although much of the move has been driven by expectations of higher inflation going forward, we have also seen a move in real yields. Indeed, the yield on long-term U.S. Treasury Inflation Protected Securities (TIPS) and Canadian Government Real Return Bonds (RRBs) moved into positive territory in February, marking the first time in over a year.


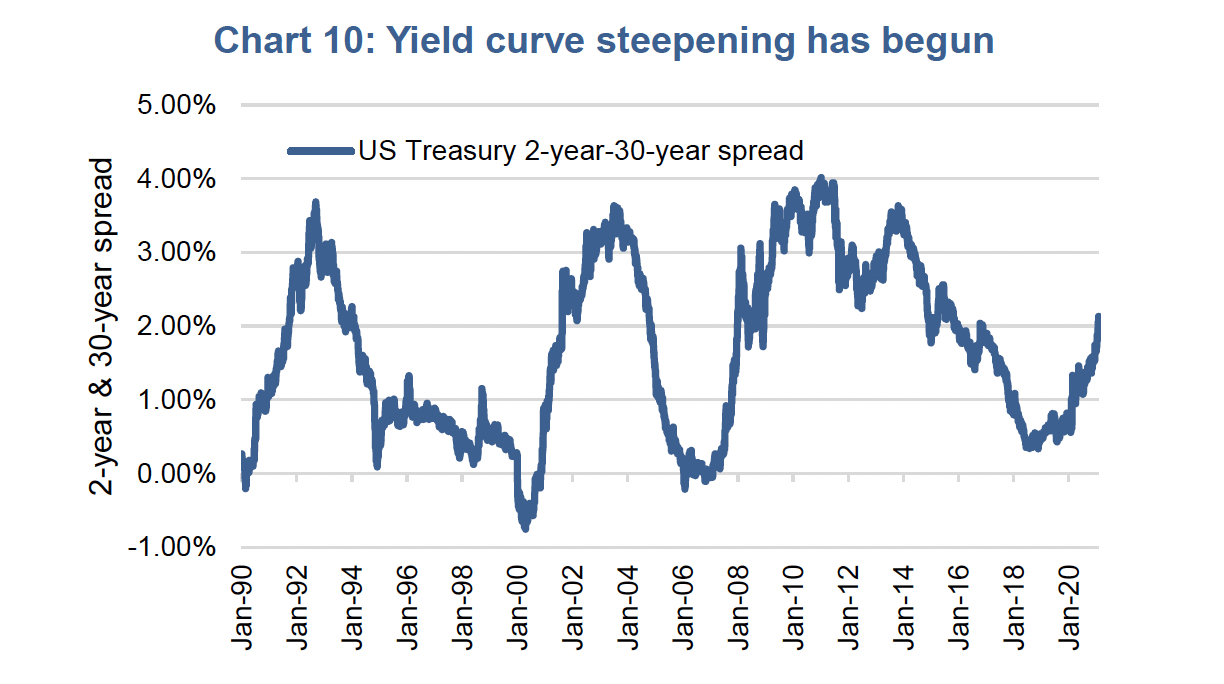
  • This has translated into a much steeper yield curve. The yield pick-up on 30-year Treasuries over 2-year Treasuries is at 2.14% at the time of writing, versus 0.60% a year ago (Chart 9).


  • Historically, the steepening of the yield curve during periods of economic expansion often peaks when the spread between 30-year Treasuries and 2-year Treasuries reaches the area of 3.50% (Chart 10).


  • This suggests we may see further weakness in longer-term bond yields in the coming months. Long bond yields could reach as high as 3.75% before central banks around the world reach their growth, employment, and inflation goals and then start to signal a willingness to raise short-term rates.


  • Historically, higher government bond yields generally lead to wider credit spreads; similarly, higher yields will often lead to weakness in risky assets given the rising attractiveness of safe assets. However, we continue to see strong demand for yield in what remains a historically low-yield environment, and the yield ratio (the percentage of credit spread of total yield) remains attractive. This should help credit markets continue to outperform in the near term. 

Charts are sourced to Bloomberg L.P. unless otherwise noted.


The contents of this publication were researched, written and produced by Richardson Wealth Limited and are used herein under a non-exclusive license by Echelon Wealth Partners Inc. (“Echelon”) for information purposes only. The statements and statistics contained herein are based on material believed to be reliable but there is no guarantee they are accurate or complete. Particular investments or trading strategies should be evaluated relative to each individual's objectives in consultation with their Echelon representative. 


Forward Looking Statements


Forward-looking statements are based on current expectations, estimates, forecasts and projections based on beliefs and assumptions made by author. These statements involve risks and uncertainties and are not guarantees of future performance or results and no assurance can be given that these estimates and expectations will prove to have been correct, and actual outcomes and results may differ materially from what is expressed, implied or projected in such forward-looking statements.

The opinions expressed in this report are the opinions of the author and readers should not assume they reflect the opinions or recommendations of Echelon Wealth Partners Inc. or its affiliates. Assumptions, opinions and estimates constitute the author’s judgment as of the date of this material and are subject to change without notice. We do not warrant the completeness or accuracy of this material, and it should not be relied upon as such. Before acting on any recommendation, you should consider whether it is suitable for your particular circumstances and, if necessary, seek professional advice. Past performance is not indicative of future results. These estimates and expectations involve risks and uncertainties and are not guarantees of future performance or results and no assurance can be given that these estimates and expectations will prove to have been correct, and actual outcomes and results may differ materially from what is expressed, implied or projected in such forward-looking statements.


The particulars contained herein were obtained from sources which we believe are reliable, but are not guaranteed by us and may be incomplete. The information contained has not been approved by and are not those of Echelon Wealth Partners Inc. (“Echelon”), its subsidiaries, affiliates, or divisions including but not limited to Chevron Wealth Preservation Inc. This is not an official publication or research report of Echelon, the author is not an Echelon research analyst and this is not to be used as a solicitation in a jurisdiction where this Echelon representative is not registered.


The opinions expressed in this report are the opinions of its author, Richardson Wealth Limited (“Richardson”), used under a non-exclusive license and readers should not assume they reflect the opinions or recommendations of Echelon Wealth Partners Inc. (“Echelon”) or its affiliates.


This is not an official publication or research report of Echelon, the author is not an Echelon research analyst and this is not to be used as a solicitation in a jurisdiction where this Echelon representative is not registered. The information contained has not been approved by and are not those of Echelon, its subsidiaries, affiliates, or divisions including but not limited to Chevron Wealth Preservation Inc. The particulars contained herein were obtained from sources which we believe are reliable, but are not guaranteed by us and may be incomplete.


Assumptions, opinions and estimates constitute the author’s judgment as of the date of this material and are subject to change without notice. Echelon and Richardson do not warrant the completeness or accuracy of this material, and it should not be relied upon as such. Before acting on any recommendation, you should consider whether it is suitable for your particular circumstances and, if necessary, seek professional advice. Past performance is not indicative of future results. These estimates and expectations involve risks and uncertainties and are not guarantees of future performance or results and no assurance can be given that these estimates and expectations will prove to have been correct, and actual outcomes and results may differ materially from what is expressed, implied or projected in such forward-looking statements.

Forward-looking statements are based on current expectations, estimates, forecasts and projections based on beliefs and assumptions made by author. These statements involve risks and uncertainties and are not guarantees of future performance or results and no assurance can be given that these estimates and expectations will prove to have been correct, and actual outcomes and results may differ materially from what is expressed, implied or projected in such forward-looking statements. 
Echelon’s Insight Team


Echelon’s Insight Team includes members in various departments such as Wealth Management, Capital Markets, Marketing, Talent, and Compliance who have subject matter expertise and collaborate together to build quality content to help our clients. This team approach helps us ensure content is produced that is meaningful, accurate and timely.

By The Echelon Insights Team 18 Oct, 2021
Inflation sucks. It is essentially a tax on those consuming goods or services, as things simply cost more. Even worse, it is a regressive tax given lower income/wealth consumers tend to spend a higher portion of their income. Now, if you are sitting comfortably on your nest egg and not spending too much, should inflation worry you? That depends on this raging debate as to whether the current spike in inflation is a blip caused by temporary demand and supply imbalances…or the start of something longer term. If inflation runs hotter for longer, the value of that nest egg erodes in real terms—clearly a risk to any long-term financial plan. Currently the good news is higher prices have been predominantly found in what the Atlanta Fed calls ‘flexible priced categories.’ Breaking down the categories in the Consumer Price Index (CPI) into those that are flexible and those that are sticky clearly demonstrates that the headline number is being almost completely pushed higher by the flexible categories. The good news is the prices in these categories can come back down just as fast, supporting the “inflation is transitory” argument. In fact, many have started this descent.  A confluence of factors caused the CPI spike. The pandemic disrupted logistic supply chains that have been increasingly run tighter over the years to reduce costs. Demand came back faster than expected and focused more on durable goods. Global spending behaviours changed quickly. Meanwhile supply adjustments are not as quick. Based on manufacturing survey data, it appears that the worse may be behind us. Readings are still high in many PMI survey questions, including slower delivery times, customer inventories too low, and backlogs rising, but they appear to have peaked a few months ago and are moving in the right direction.
By The Echelon Insights Team 12 Oct, 2021
The market advance over the past year has truly turned a lot of heads, in a good way. After the initial bear and bounce triggered by the Covid-19 pandemic, markets went on a phenomenal run. The rollout of vaccines driving the re-opening trend in the economy helped, as did the continued emergency monetary and fiscal support policies. And what a run. During this advance, consumer spending pivoted much more to durables such as vehicles, homes, and technology. While nominal GDP doesn’t care as much where an individual decides to spend their money, the equity markets much prefer you buy some durables instead of services (like a dinner). 
By The Echelon Insights Team 04 Oct, 2021
Challenges ahead — Greg Taylor September has once again lived up to its reputation for volatility. In many ways this had to be expected as equity markets have experienced one of the longest runs of stable returns and minimal drawdowns in history. However, the timing of this recent volatility should not surprise many, as most of the positive tailwinds that have carried the market to these levels are starting to fade away, setting up what could be a difficult period for capital markets. Global central banks are the biggest and most important factor that have helped elevate recent returns. To their credit, they learned from the mistakes of the global financial crisis where indecision and delay exacerbated things—this time, right from the beginning, the banks did everything they could to help the markets and the economy. But all good things must come to an end, and 18 months after the start of the pandemic, it is time for central banks to begin to remove some emergency measures. This isn’t a bad thing at all. Central banks need to begin to normalize policy to prepare for the next crisis. But it is a change from the recent normal and means that central banks may be less accommodating for the next while. This action resulted in bond yields moving higher across the curve and has led to a change in sector leadership. The growth/value trade has been a subject of much debate over the last few years. As growth has dominated in a period of ever lower bond yields, with the threat of inflation, has this turned? Will the rally in energy be the trigger to get this going once again? The energy sector was a victim of the climate movement, but the resulting cuts to production may be setting us up for a bull market in the commodities as we are already seeing shortages in both natural gas and heating oil. The resulting price increases is also adding further ammunition to the inflation argument as higher costs will undoubtably flow through to the price of goods. What no one really expected in the month was the China risk. Consistently over the last year, China has been working to extend their influence over the capital markets, which has caused many to question if China is at all investible? Their constant clamp down on social media and other growth sectors became a secondary concern as their largest construction company ran into liquidity issues. Evergrande was never going to be a Lehman moment, but it had the potential to leave some scars. For the moment, this risk has faded to the background, but it can’t be ignored and has the potential to flare up once again. What could prove to be the biggest risk to the markets in the near term is earnings season. With the advent of quant funds gaining a greater market share, we have seen companies that beat earning expectations gain versus those that don’t. But as easy comparable estimates fade, huge beats will be harder to achieve. We have already seen some notable companies miss these expectations and the risk is that the next month will be filled with negative earnings revisions. One of the biggest reasons for earning misses has been from broken supply chains. Covid lockdowns and pulled-forward demand for goods did immeasurable damage to the concept of ‘just-in-time’ inventory models. Companies continue to scramble for components, such as semiconductors, in order to product goods. As indicated by the surge in used car prices, the automotive sector has been one of the hardest hit. Until this is fixed, we must expect inflated prices of goods and services and squeezing margins. Whether this is temporary or permanent is still up for debate, but its another headwind to markets.
MORE POSTS →
Share by: