The market advance over the past year has truly turned a lot of heads, in a good way. After the initial bear and bounce triggered by the Covid-19 pandemic, markets went on a phenomenal run. The rollout of vaccines driving the re-opening trend in the economy helped, as did the continued emergency monetary and fiscal support policies. And what a run. During this advance, consumer spending pivoted much more to durables such as vehicles, homes, and technology. While nominal GDP doesn’t care as much where an individual decides to spend their money, the equity markets much prefer you buy some durables instead of services (like a dinner).
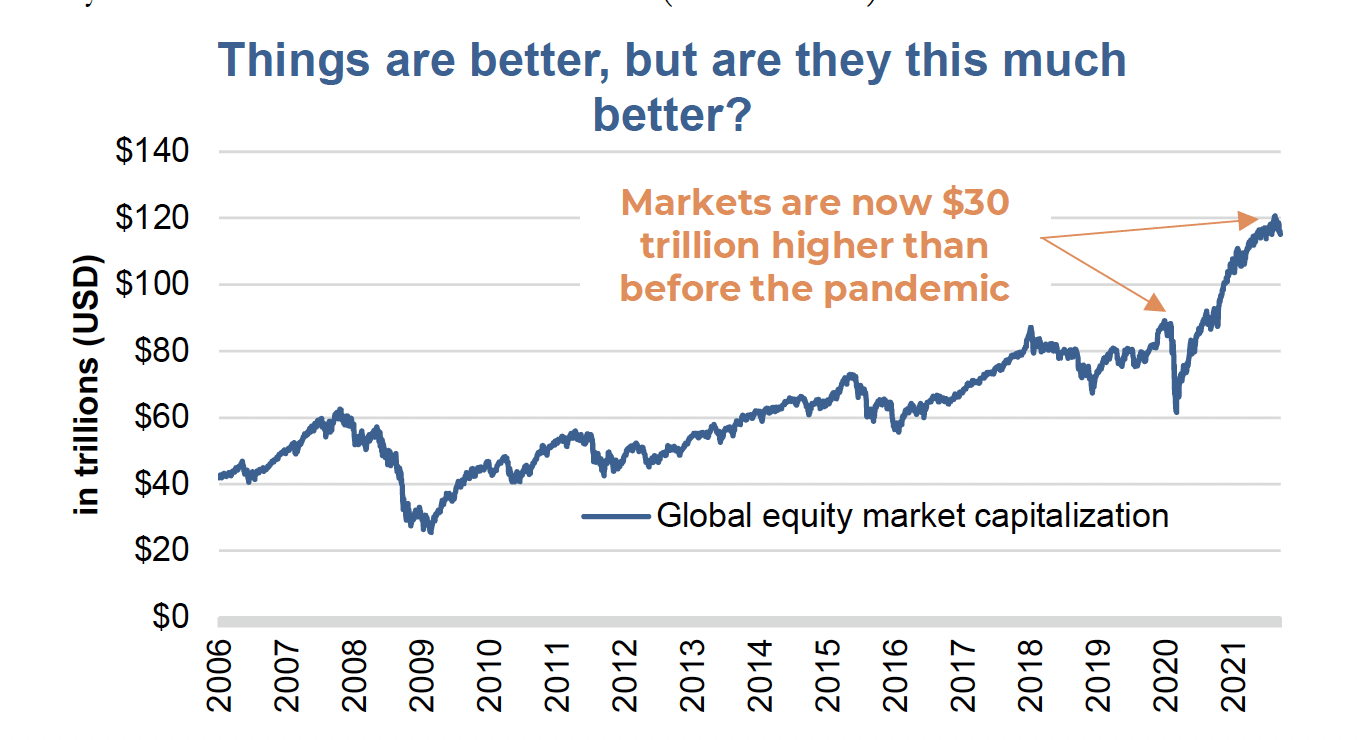
All this good market news has lifted the global market capitalization of equities to about $120 trillion—a full $30 trillion higher than before the
pandemic hit.
This is incredible as it sure doesn’t feel like the world is 33% better off than before the pandemic. In fact, it took a decade to add $30
trillion to the global market cap from the peak before the global financial crisis. The latest $30 trillion took a year and a half.
It is not just the spending habits that changed. Given the market performance and high savings rates (since many are not spending as much on services),
markets have enjoyed solid inflows over the past year. That super-charged savings rate isn’t just being tucked away in bank accounts.
With temporarily changed behaviours combined with monetary/fiscal policy, this may have dragged forward future performance. Or, in other words, some
of these abnormally high returns may mean revert, leading to more muted returns ahead. To demonstrate how far outside the norm some markets have moved, lets take a look from a few different perspectives.
There is no denying the economy and the market, while related, can behave very differently at times. Equities can go up or down while the economy remains stable. Sometimes, the economy accelerates and the market retreats. Variances in the direction of the markets and the economy led to the often-used phrase, “the market is not the economy.”. And while that may seem like the case at times, there is a strong tether between the two.
The economy drives corporate earnings and if there were a constant valuation multiple placed on earnings, the relationship between the economy and the market would be clearer. But once investor sentiment gets in there, sometimes paying more for a dollar of earnings, sometimes less, the waters are muddied.
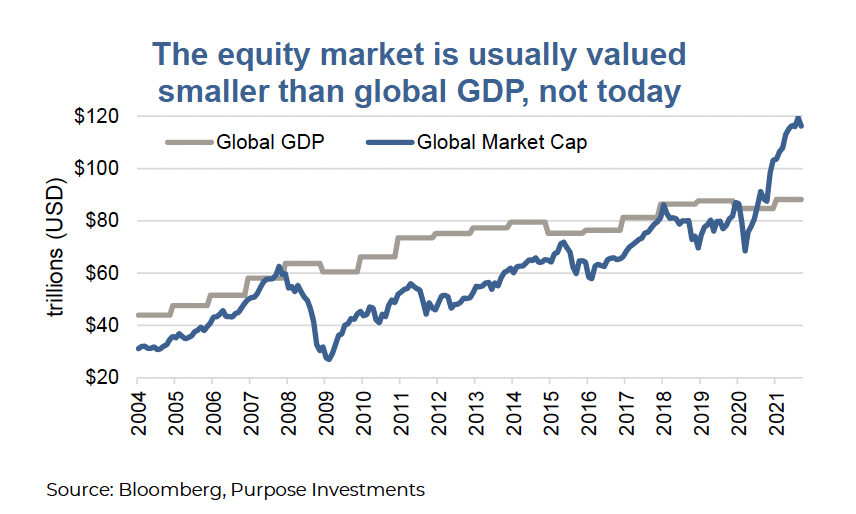
Based on the global GDP measure vs the global equity market valuation, we appear to be in some uncharted territory. Just looking at the chart, you can see this is far from a perfect relationship, but you may also see that when GDP is rising nicely so is the market. And when GDP growth slows or falls, as does the equity market…roughly speaking. Nonetheless, the advance in the equity market of late does not seem anywhere near commensurate to the advance in the economy. Also worth noting is that the global GDP metric is annual and the move up from 2020 to 2021 is forecast to slow from 2021 to 2022.
There is a connection between the economy and the market but comparing them is comparing apples to oranges. The measure for the economy as we know is GDP: an annual number that attempts to capture all economic activity. In other words, if all economic activity stopped for a year, GDP would be zero. Meanwhile, a company’s value is most often based on its earnings capabilities: both today and into the future. Clearly a temporal mismatch.
So let us simplify it even further.
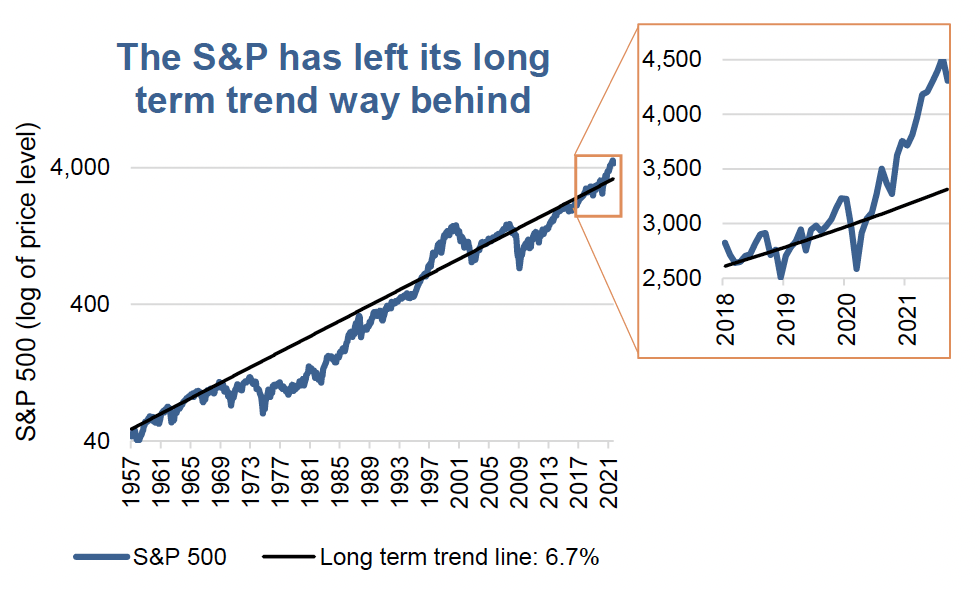
For the S&P 500, ignore the size relative to the economy, ignore the price-to-earnings, sales, book, EBITDA, DCF, etc. Instead, just look at the long-term return relative to the return of late. This chart is the S&P 500 since the 1950s with a least squares trendline. The trendline works out to an annualized 6.7%, excluding dividends. Add a point or two from dividends, a respectable return. But clearly over the past couple years the S&P 500 briefly dipped below trend during the pandemic induced bear market then rocketed well above. Not as far above as the 1990s tech bubble but getting closer.
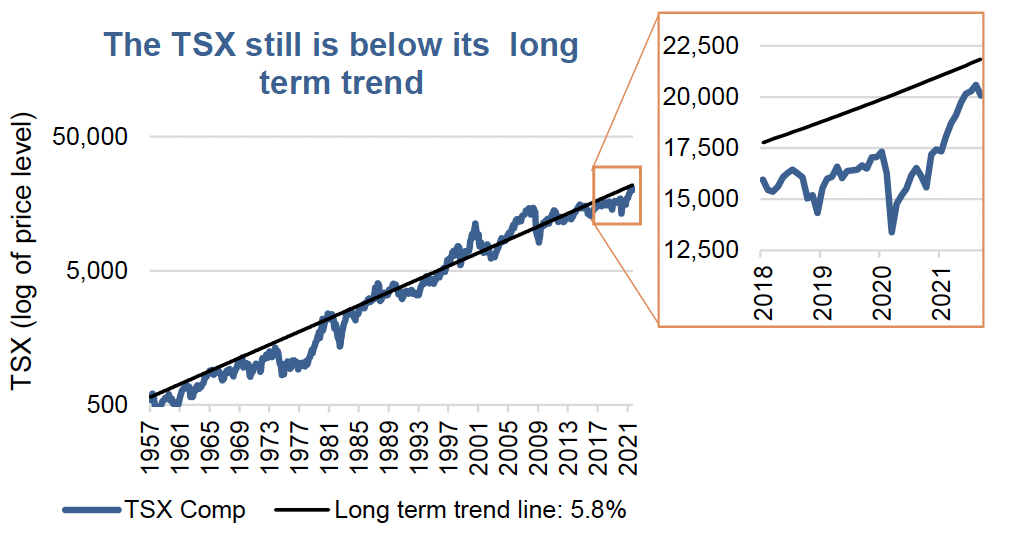
Turning to Canada’s TSX, things certainly look more interesting and to be less of a concern. Note the long-term trend line has a compound growth rate of 5.8% during this period, but the TSX has historically enjoyed a higher dividend yield. Hence, the performance spread of the S&P outperforming the TSX is lower than this would imply. More importantly while the U.S. equity market is well above its trend, the TSX is still below its trend.
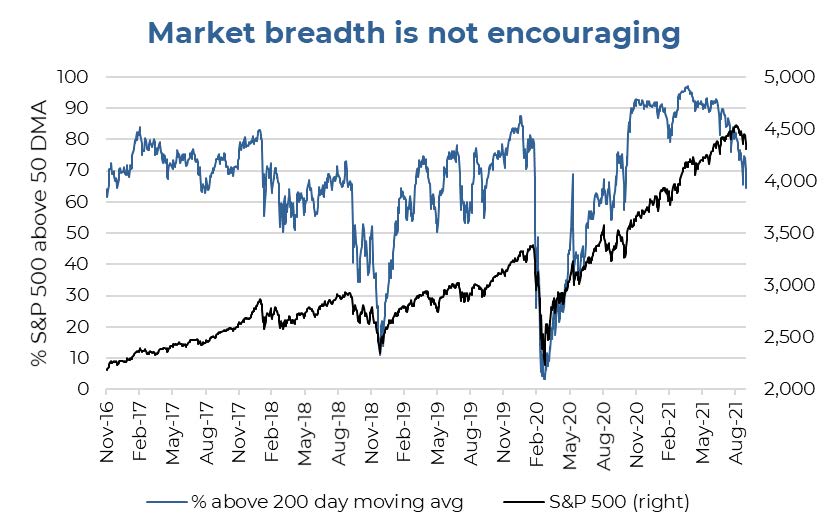
It’s a narrowly advancing stock market compared with earlier this year. The NYSE advance/decline line has yet to catch up to the peak in early June. Similarly, the percentage of stocks trading above their 200-day moving average has fallen steadily over the past four months to a current reading of just over 50%.
Investment implications
“This time is different,” is often labeled the most expensive words for an investor’s portfolio. This investor lesson is based on mean reversion. When things go on for too long or get too excessive, they often revert back to the mean or often below it for a time. The world may be different. The ongoing policy experiment with Modern Monetary Theory could be changing the rules. Perhaps TINA (i.e., “there is no alternative”) is the reason markets will keep rising. Maybe Elon Musk’s giving his new puppy the name Floki is worth a few billion in the crypto market in its namesake. Maybe I should launch the Baxter coin. And maybe these markets keep going for months or quarters or a year+. History says otherwise and there is a mean reversion out there that will likely be bigger the more this market goes from here. The timing of it remains anyone’s guess, but keeping a defensive tilt remains out mindset.
Charts are sourced to Bloomberg L.P. unless otherwise noted.
The contents of this publication were researched, written and produced by Richardson Wealth Limited and are used herein under a non-exclusive license by Echelon Wealth Partners Inc. (“Echelon”) for information purposes only. The statements and statistics contained herein are based on material believed to be reliable but there is no guarantee they are accurate or complete. Particular investments or trading strategies should be evaluated relative to each individual's objectives in consultation with their Echelon representative.
Forward Looking Statements
Forward-looking statements are based on current expectations, estimates, forecasts and projections based on beliefs and assumptions made by author. These statements involve risks and uncertainties and are not guarantees of future performance or results and no assurance can be given that these estimates and expectations will prove to have been correct, and actual outcomes and results may differ materially from what is expressed, implied or projected in such forward-looking statements.
The opinions expressed in this report are the opinions of the author and readers should not assume they reflect the opinions or recommendations of Echelon Wealth Partners Inc. or its affiliates. Assumptions, opinions and estimates constitute the author’s judgment as of the date of this material and are subject to change without notice. We do not warrant the completeness or accuracy of this material, and it should not be relied upon as such. Before acting on any recommendation, you should consider whether it is suitable for your particular circumstances and, if necessary, seek professional advice. Past performance is not indicative of future results. These estimates and expectations involve risks and uncertainties and are not guarantees of future performance or results and no assurance can be given that these estimates and expectations will prove to have been correct, and actual outcomes and results may differ materially from what is expressed, implied or projected in such forward-looking statements.
The particulars contained herein were obtained from sources which we believe are reliable, but are not guaranteed by us and may be incomplete. The information contained has not been approved by and are not those of Echelon Wealth Partners Inc. (“Echelon”), its subsidiaries, affiliates, or divisions including but not limited to Chevron Wealth Preservation Inc. This is not an official publication or research report of Echelon, the author is not an Echelon research analyst and this is not to be used as a solicitation in a jurisdiction where this Echelon representative is not registered.
The opinions expressed in this report are the opinions of its author, Richardson Wealth Limited (“Richardson”), used under a non-exclusive license and readers should not assume they reflect the opinions or recommendations of Echelon Wealth Partners Inc. (“Echelon”) or its affiliates.
This is not an official publication or research report of Echelon, the author is not an Echelon research analyst and this is not to be used as a solicitation in a jurisdiction where this Echelon representative is not registered. The information contained has not been approved by and are not those of Echelon, its subsidiaries, affiliates, or divisions including but not limited to Chevron Wealth Preservation Inc. The particulars contained herein were obtained from sources which we believe are reliable, but are not guaranteed by us and may be incomplete.
Assumptions, opinions and estimates constitute the author’s judgment as of the date of this material and are subject to change without notice. Echelon and Richardson do not warrant the completeness or accuracy of this material, and it should not be relied upon as such. Before acting on any recommendation, you should consider whether it is suitable for your particular circumstances and, if necessary, seek professional advice. Past performance is not indicative of future results. These estimates and expectations involve risks and uncertainties and are not guarantees of future performance or results and no assurance can be given that these estimates and expectations will prove to have been correct, and actual outcomes and results may differ materially from what is expressed, implied or projected in such forward-looking statements.
Forward-looking statements are based on current expectations, estimates, forecasts and projections based on beliefs and assumptions made by author. These statements involve risks and uncertainties and are not guarantees of future performance or results and no assurance can be given that these estimates and expectations will prove to have been correct, and actual outcomes and results may differ materially from what is expressed, implied or projected in such forward-looking statements.